
A cache hit ratio measures how often requests are served from the cache instead of the database. It’s a useful signal, but an unreliable goal. A high hit ratio doesn’t guarantee better performance, and chasing it can lead to wasted resources and missed optimizations.
This is a classic case of Goodhart’s Law: once a measure becomes the target, it loses value. If your real aim is application speed and efficiency, you need a broader view that balances latency, cost, and data accuracy.
At Redis, we don’t discard hit ratio, but we put it in context: intelligent caching strategies that deliver performance, not just numbers.
What is a cache hit ratio?
A cache hit ratio, sometimes called hit rate, is the ratio of data requests served from the cache to total requests. In simple terms, if there were 100 requests and 90 served from the cache, the cache hit ratio would be 90%.
Generally, a higher cache hit ratio means your system is finding data in the cache more often, which is faster than finding it in your traditional database. A lower ratio, in contrast, means your system is having to request data from the slower database more frequently, which often leads to latency and inefficiency.
As we’ll see, however, this high-level pattern can get much more nuanced when operating at a large enough scale.
How to monitor cache hit ratio effectively
Calculating your cache hit ratio is simple, and you can capture it in a single formula: (keyspace_hits / (keyspace_hits + keyspace_misses)).
The nuance comes in once you start monitoring your cache hit ratio over time. The key is to focus on trends and not get distracted by isolated events. If your cache hit ratio regularly dips after deployment, for example, and climbs back up again, you might have a cold cache issue.
The granularity with which you monitor your cache hit ratio can depend on your use case, too. Evan Morikawa, who led OpenAI’s applied engineering team as ChatGPT launched and scaled, found that cache misses were especially expensive for them.
“If there’s a cache miss, we need to recompute a whole ChatGPT conversation again! And we’re at the 1,000th character, so that could be closer to 1 million operations,” Morikawa writes. “Cache misses have massive, nonlinear influence on how much work the GPUs do. The higher the cache miss rate, the more that the GPUs need to work quadratically, not linearly.”
Treat your cache hit ratio like an initial diagnosis. A fever is a symptom, but the cause might be the flu. Similarly, your cache hit ratio might be low, but the real cause might be other issues measured by other metrics below the surface. Consider whether these metrics might be behind a hit rate dip:
- Eviction rate: This metric captures how many keys have been evicted from the cache due to memory limits. High eviction rates can correlate with low hit rates.
- Memory usage: If the cache you’re using is at or nearing its maximum memory limit, it will increase the eviction rate, which can reduce the hit rate.
- Query latency: If your backend queries are slow and requests time out, the cache might not get populated, keeping the hit ratio low. When the cache isn't being populated or is being bypassed due to timeouts, every request goes directly to the origin. This further increases the backend's slowness, potentially leading to a "thundering herd" problem where the backend collapses under the load.
With these metrics, you can exceed the simplistic picture cache hit ratio alone can provide. With a three-dimensional picture of what’s really going on, you can start to develop a more precise strategy for improving app performance.
How to optimize cache hit ratio for performance and cost efficiency
Remember: The true goal behind measuring cache hit ratio is to improve performance and cut costs. A 2024 study found that, counter to common intuition, “increasing the hit ratio can actually hurt the throughput (and response time) for many caching algorithms.”
As a result, improving performance isn’t just about storing as much data as possible in the cache to increase the hit rate. You have to cache intelligently and tune your systems to ensure the right data stays in the cache so that it can be served quickly.
Fine-tune cache eviction policies
Your cache eviction policies are often at the root of cache hit ratio issues, but you must carefully fine-tune these policies to match your scenario.
Request frequency plots and access pattern graphs can help you map out what your scenario really looks like in practice. When you start fine-tuning your eviction policies, you can refer back to these plots and graphs to ground your new policy decisions.
If you’re scaling AI and ML workloads, for example, consistent access patterns are important. LFU (Least Frequently Used) eviction policies prioritize retaining the data you need to access most frequently, which makes them especially useful when your system is repeatedly using particular datasets or models (as with AI).
TTL-based expiration policies, which automatically remove data from your cache after a pre-specified duration, are similarly useful. These policies ensure stale information doesn’t persist in your cache, an especially effective approach for time-sensitive data, such as recent posts in a social media app, which are time-sensitive but can tolerate minor delays.
Often, the most effective approach combines LFU- and TTL-based approaches into a hybrid eviction policy. With a hybrid model, you can retain access to the most frequently accessed data (via LFU) and ensure that stale information is regularly purged (via TTL). By combining approaches, you can better address situations where data relevance might change over time, such as in recommendation systems.
Implement near-caching for faster lookups
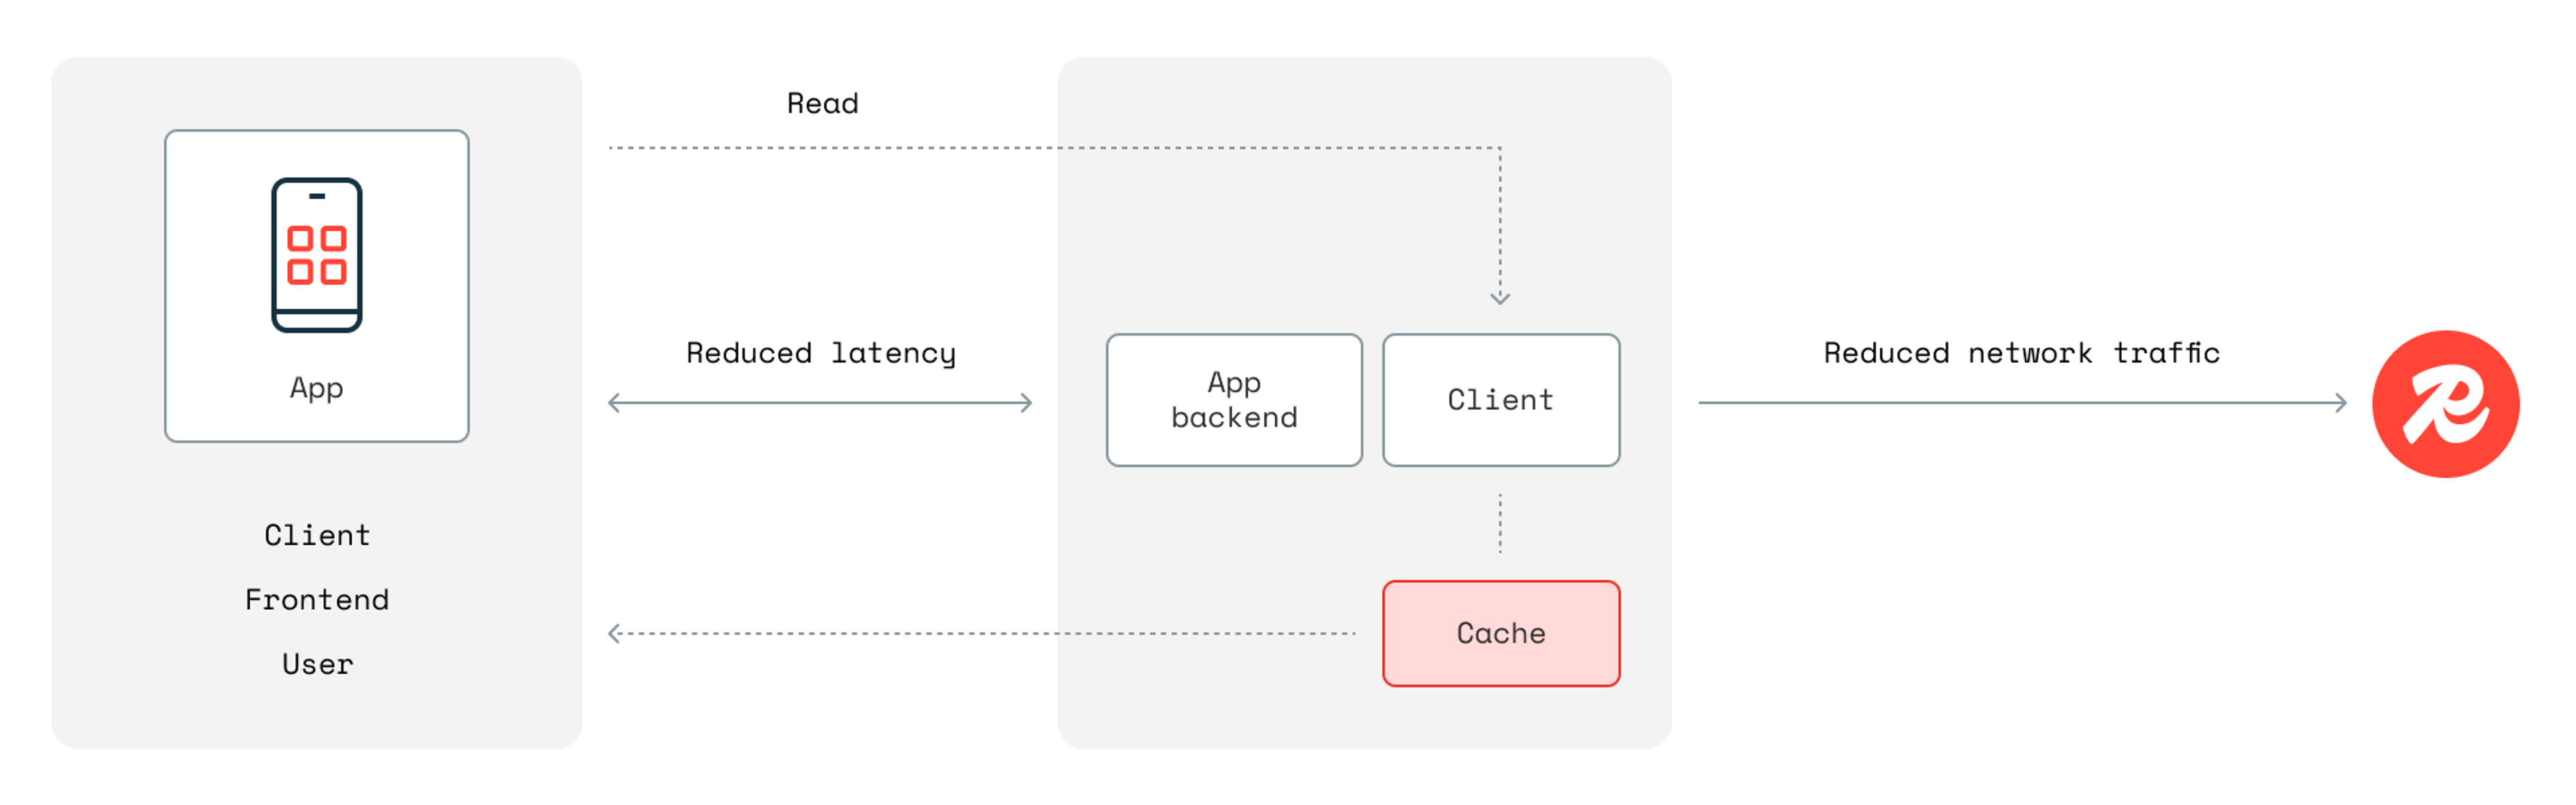
Near-caching, or client-side caching, reduces unnecessary cache misses by storing frequently accessed data closer to the application.
Rather than just keeping a cache near your cache server, this approach allows you to keep the cache within the application process itself. If the same application instance repeatedly requests the same data, near-caching ensures that data is served from local memory.
Redis Community Edition started supporting near-caching in version 6, but we introduced official open-source client libraries in 2024. Redis users can enable near-caching with just a few lines of code, reducing network traffic and latency.
In the Python code example below, all you have to do is enable caching when you establish the connection.
Companies like Flowdesk have used Redis to cache data about orders, prices, and market movements across hundreds of databases.
Reduce memory costs with hybrid caching
The simplest way to improve your cache hit ratio is to overallocate RAM, boosting the number of hits. But the simplest solution is rarely the best way, especially at scale.
Redis Flex takes a different approach. By dynamically shifting less critical data to solid-state drives (SSDs), users can cut memory costs by up to 80% – all while preserving performance. Users can get 5GB of cache storage for the same price as 1GB, and manage small caches without taking on overly complex caching strategies or endlessly tweaking application logic.
Ekata, a provider of identity and fraud prevention software, used Redix Flex to cut infrastructure costs without incurring any latency tradeoffs. “We now only use 30% of the DRAM storage we previously used, with no sacrifice in latency,” reports Varun Kumar, Senior Vice President of Engineering at Ekata. “That equates to hundreds of thousands of dollars in infrastructure savings each year.”
Monitor cache performance in real-time
Cache performance can shift over time, and it can sometimes be difficult to notice the patterns that might indicate why the hit rate dips. Instead of poring over the data manually, find observability tools that can help you monitor hit/miss patterns, memory utilization, and eviction events.
Redis, for example, integrates with Prometheus and Grafana, which allow you to collect and visualize any of the metrics associated with your Redis Enterprise instance.
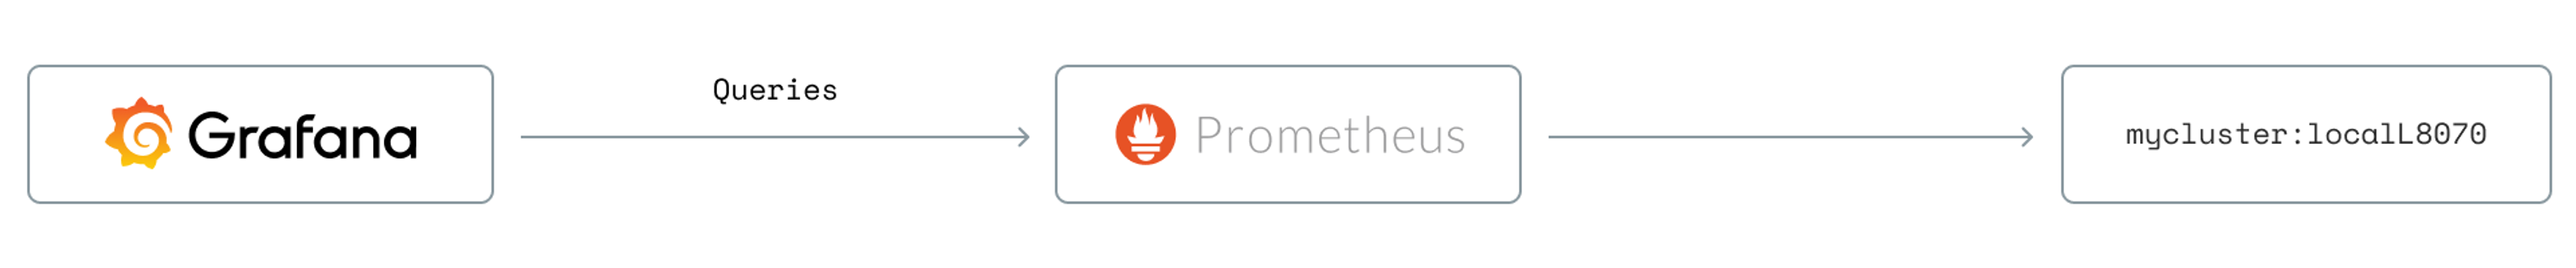
By combining these tools, you can collect and display metrics that aren’t available in the admin console, set up automatic alerts, and collate Redis metrics alongside data from other systems.
Beyond hit ratio: the future of intelligent caching
The strategies above will get you far, but modern caching, driven by AI-supported approaches that can self-optimize and automate, will get you even further.
AI is not a panacea, however. Some AI tools can introduce inaccuracies, which can become especially problematic when caching things like recommendations or trend analyses. AI-based approaches require guardrails, oversight, and above all, a platform that ensures you can tune AI to your needs.
At scale, every millisecond matters, so once you have your foundation built, evaluate how you can integrate intelligent caching to shave off even more time.
Always in sync caching
Traditional caches are reactive, and eviction policies frequently need to be rewritten after the fact. Redis Data Integration (RDI), in contrast, synchronizes data from existing databases into Redis in near real time, allowing you to scale without excessive database costs or excessive manual fine-tuning.
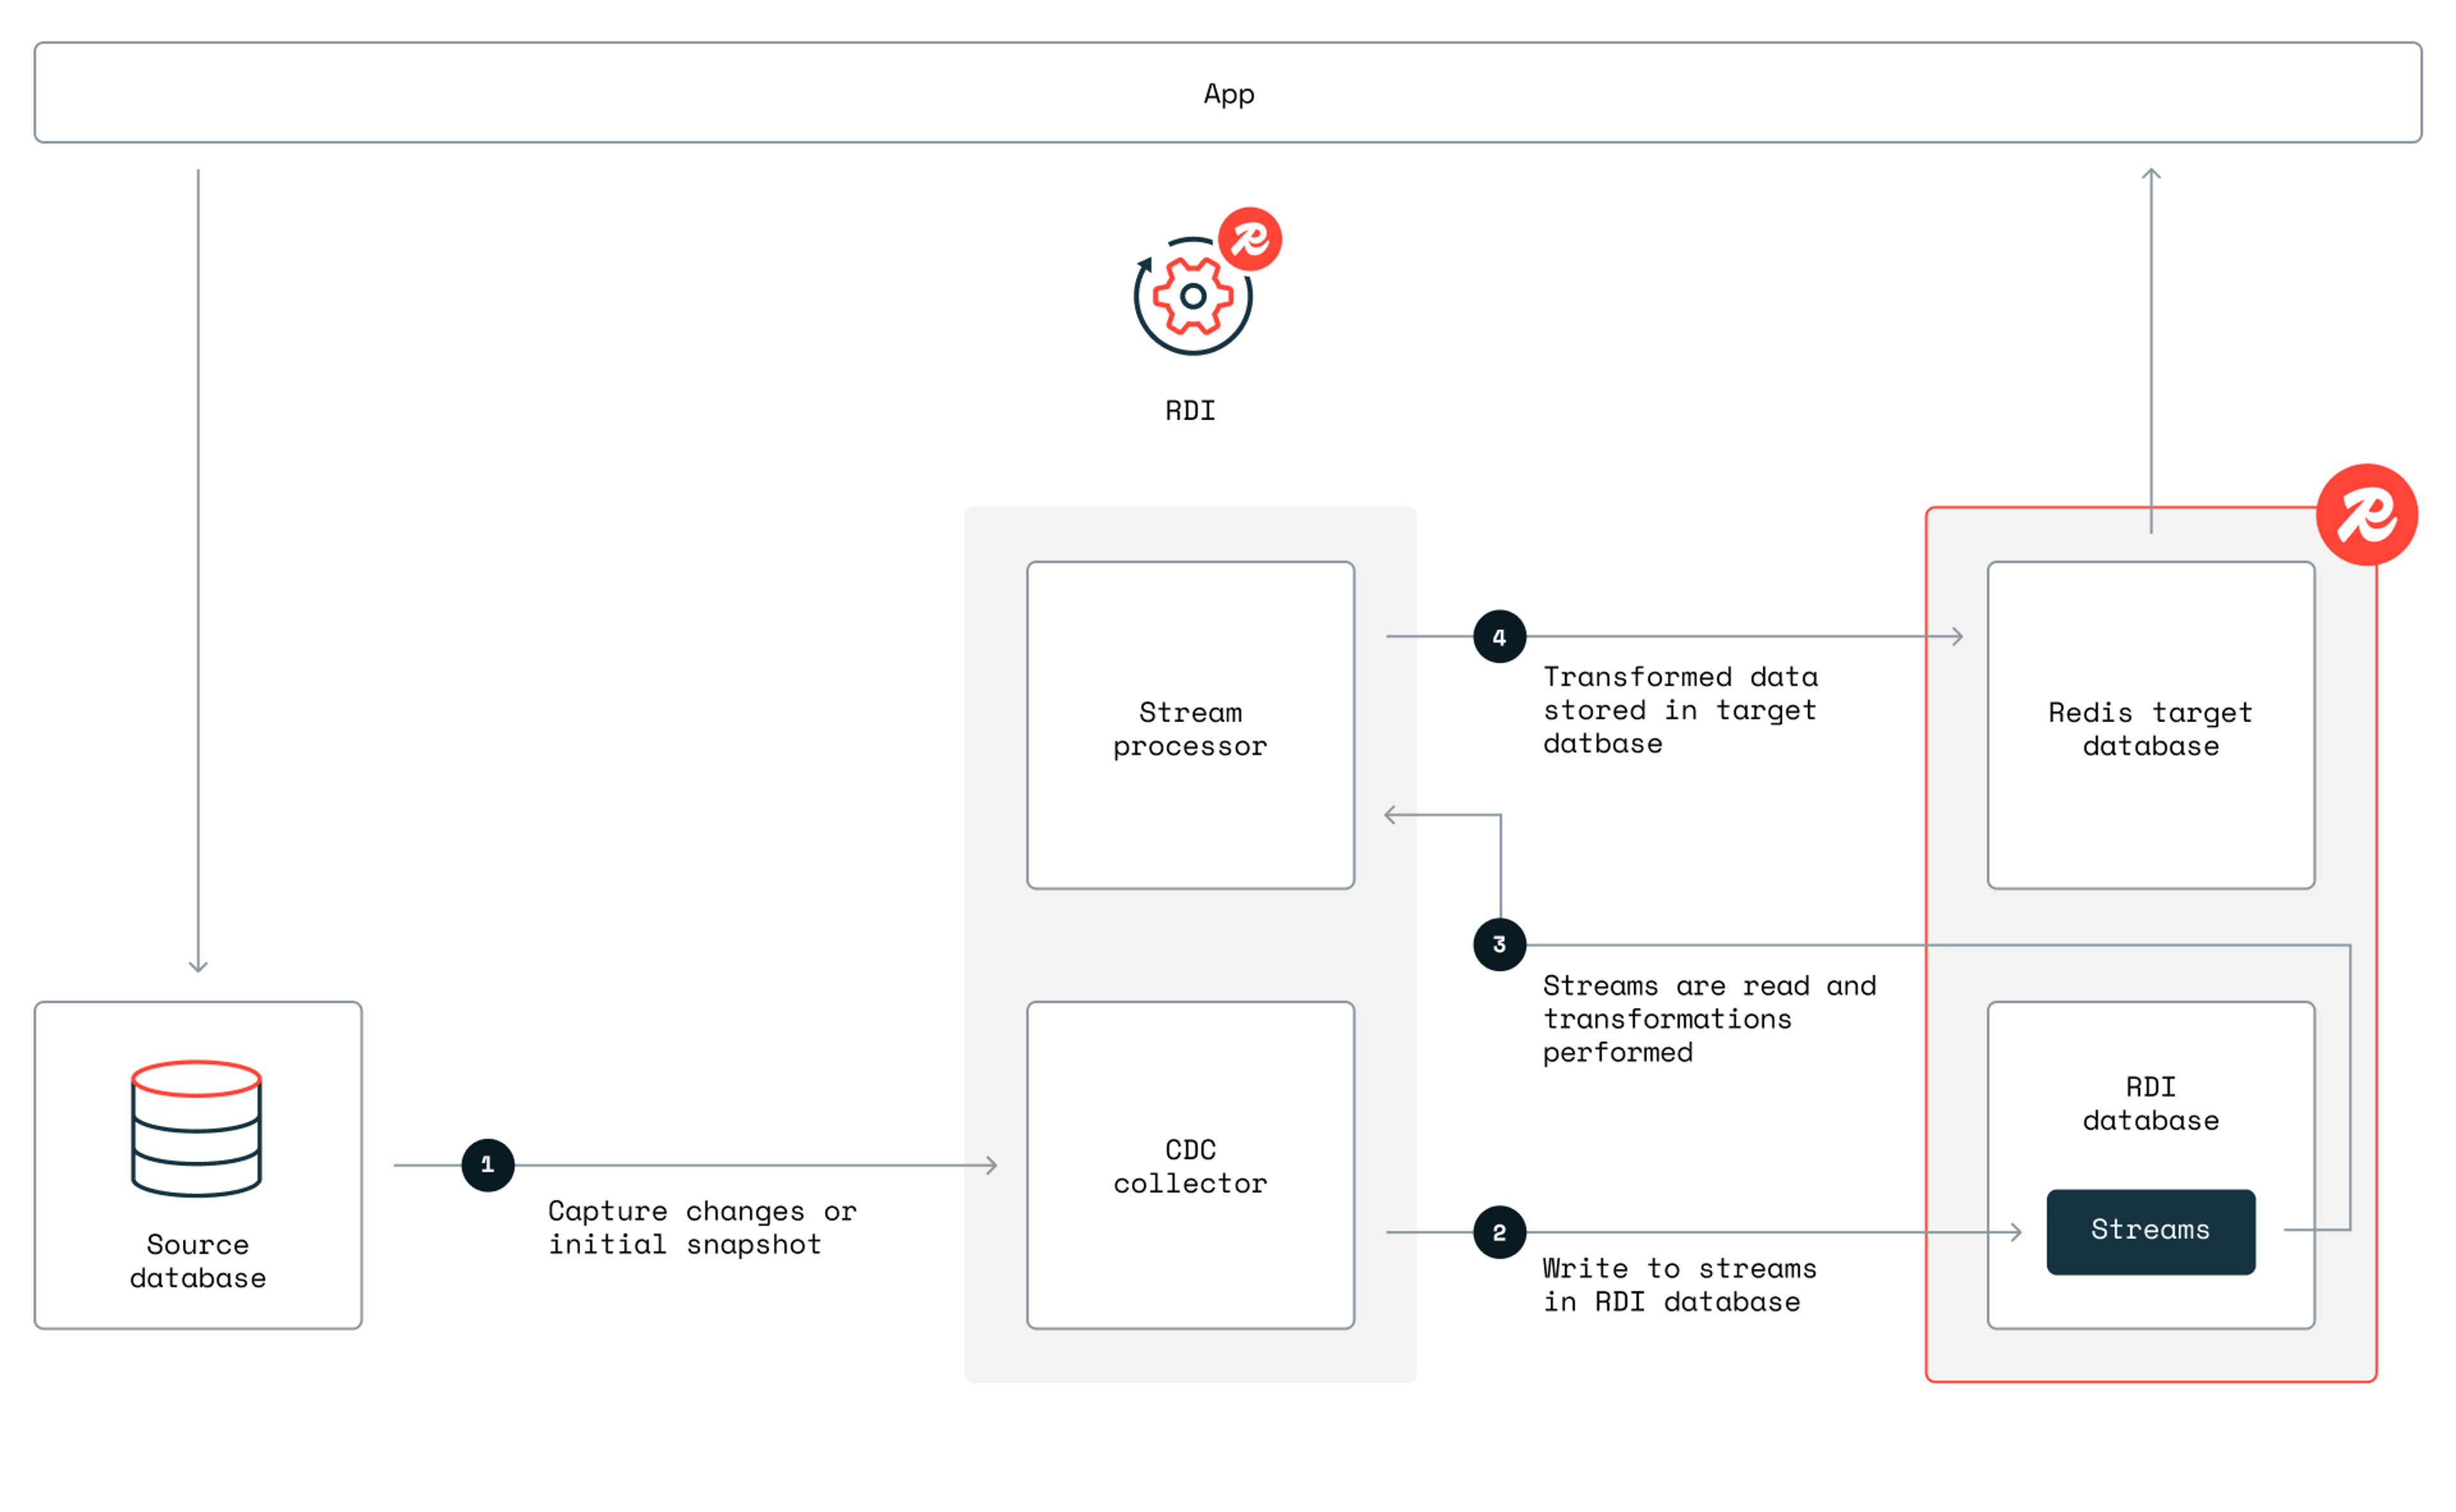
With RDI, you can eliminate cache misses outright, avoid using stale data, and skip building complex data pipelines just to sync your data.
AI-driven caching supports smarter prefetching
Traditional caches store data passively, but Redis is developing predictive caching strategies that preload high-probability requests. Redis LangCache can shorten latency times and cut LLM costs via semantic caching, which stores and reuses previous LLM responses for repeated queries.
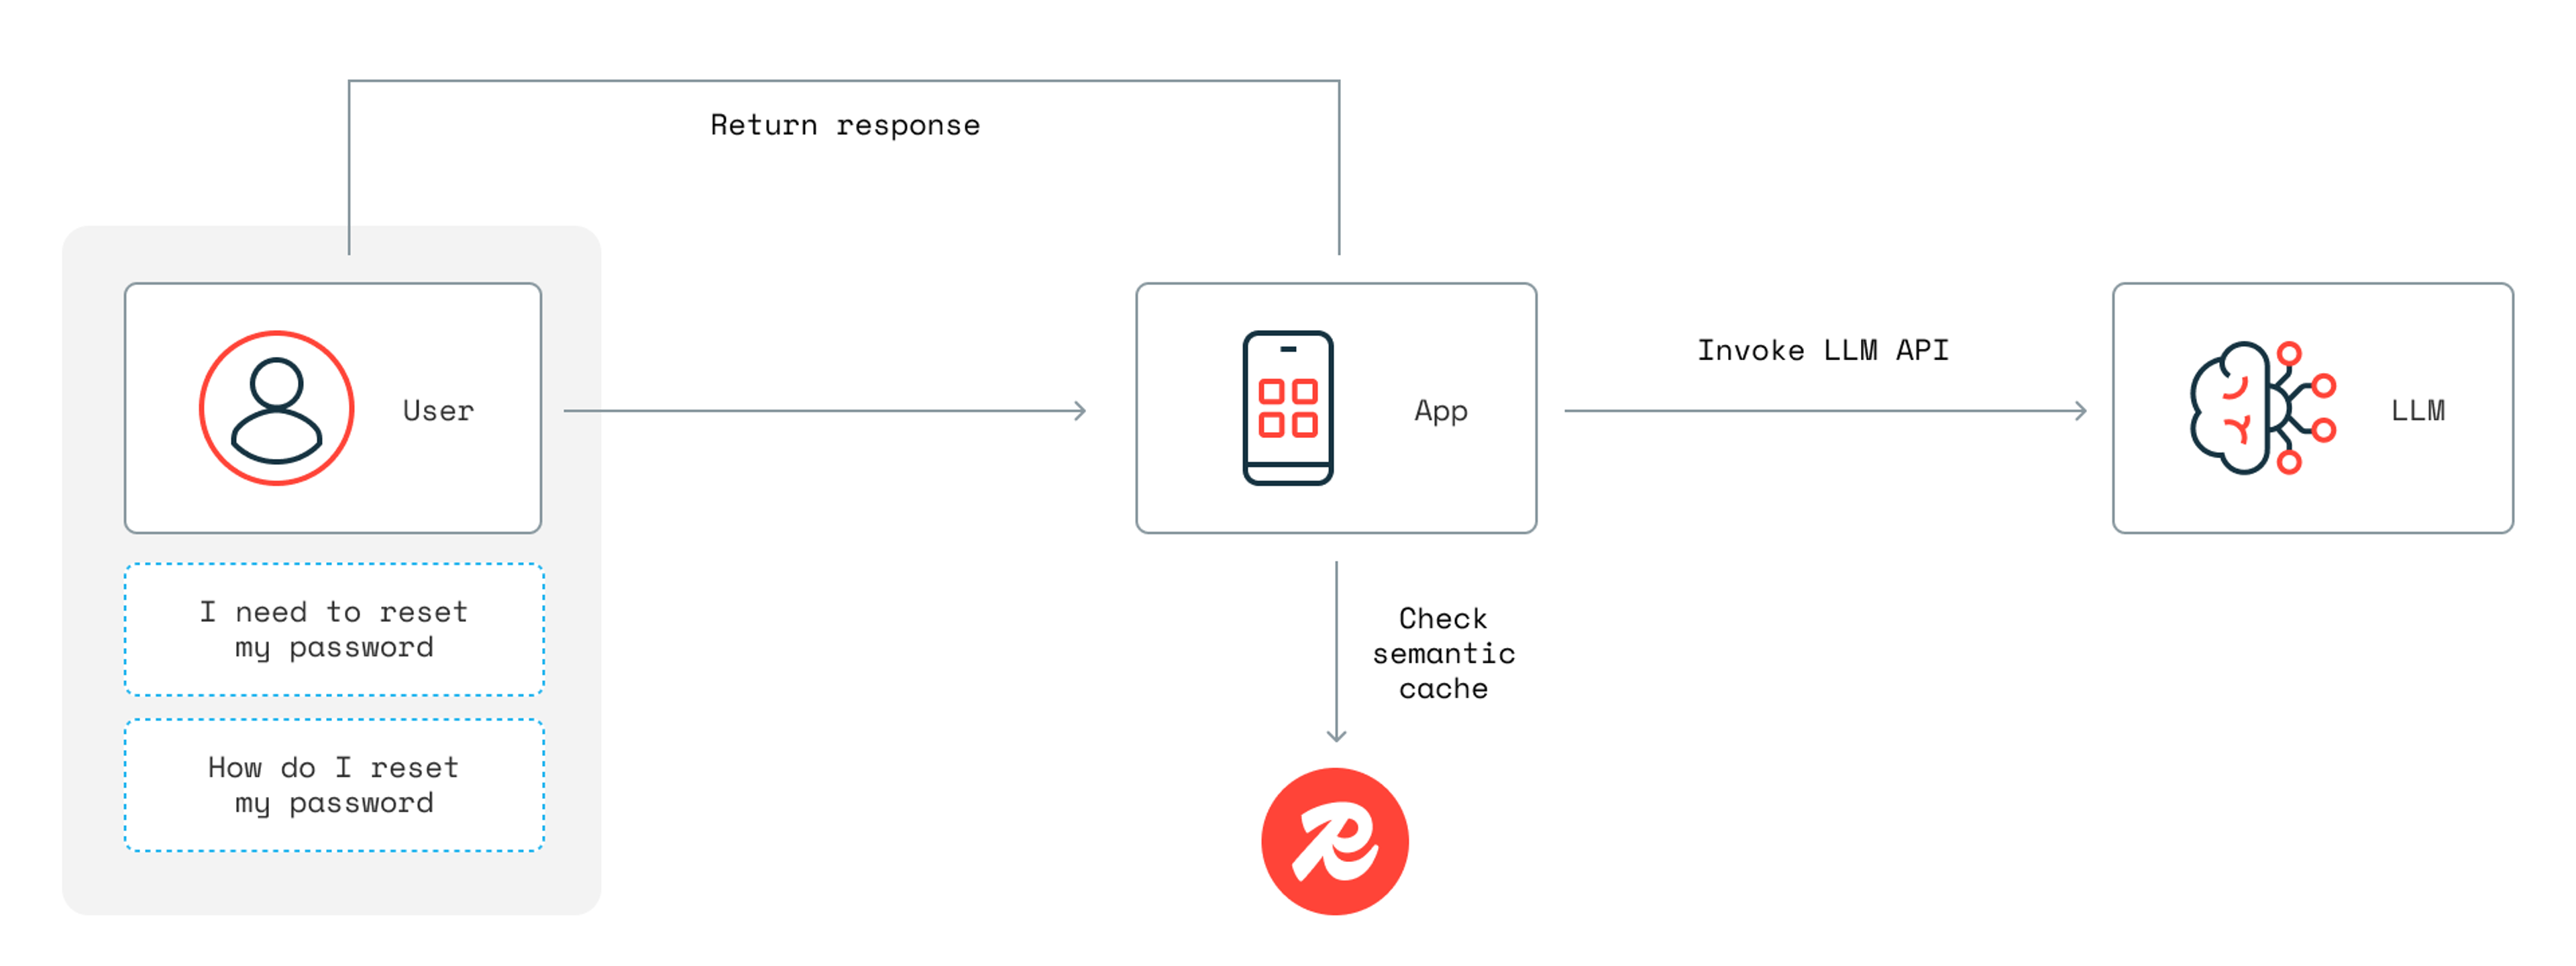
With LangCache and semantic caching, you can avoid the costly process of calling an LLM for every request and instead instantly return requests that have already been cached, saving time, money, and effort.
Self-optimizing cache automation
Redis gives users the ability to optimize evictions and memory allocation, allowing for a fine-tuned, automatic approach to cache management. In the future, Redis will add intelligence that supports even more granular policies, supported by AI-based functions, that can self-optimize cache choices on the fly.
Scaling caching in distributed architectures
Manually tuning your caching policies is sometimes reasonably practical in small-scale deployments, but once you’re operating a distributed architecture at scale, you need cache infrastructure that can scale with you.
Distributed caching, as opposed to local caching, requires the sometimes complex work of storing data across numerous machines or nodes, often connected together in a network. Enterprises that need to scale across multiple servers, especially if those servers are distributed geographically in different availability regions, need distributed caching to ensure data is ready to be retrieved wherever and whenever it’s needed.
For multi-cloud and hybrid environments, Redis’ tiered caching ensures global availability without performance bottlenecks. Cache servers can store temporary data across multiple nodes, and each cache server can operate independently, allowing the system to recover from server failure, reroute requests as necessary, and support high availability.
Optimize your cache hit ratio with Redis
Cache hit ratio is an important metric, but it’s still just a signal. Your hit rate indicates potential performance problems, but solving those problems, at their root, requires a more holistic perspective.
With Redis, you can use real-time monitoring, adaptive eviction policies, and hybrid caching to ensure the maximization of efficiency without unnecessary memory overhead. Redis isn’t just a caching solution—it’s a performance-first, cost-efficient platform that enables businesses to optimize caching beyond hit ratios.
Don’t let inefficient caching slow down your applications or drive up costs. With Redis, you can monitor, optimize, and scale your cache hit ratio for maximum efficiency. Try Redis for free or book a meeting with our team to discuss your caching needs.
Get started with Redis today
Speak to a Redis expert and learn more about enterprise-grade Redis today.